How Zone Diagrams Are Built for Denver Buildings
Roof zone diagrams for Denver commercial buildings - the permanent reference system that makes every inspection, post-hail assessment, moisture survey, and capital report useful and comparable over time.
Every inspection report, post-hail assessment, moisture survey, and capital document we produce for a Denver building is anchored to a zone diagram specific to that building. The diagram is the permanent reference that survives hail seasons
A photograph of a roof defect means nothing if you cannot locate it precisely on the roof. An inspection report that reads 'membrane deterioration at west parapet' is not useful documentation if the building has 300 linear feet of west parapet and you cannot identify which section the report refers to. After a hail event, a post-storm assessment that references 'damage at the northwest corner' is not adequate documentation for an insurance claim or a manufacturer warranty notification. Zone diagrams solve this problem by creating a numbered, physically anchored reference system that every subsequent report uses.
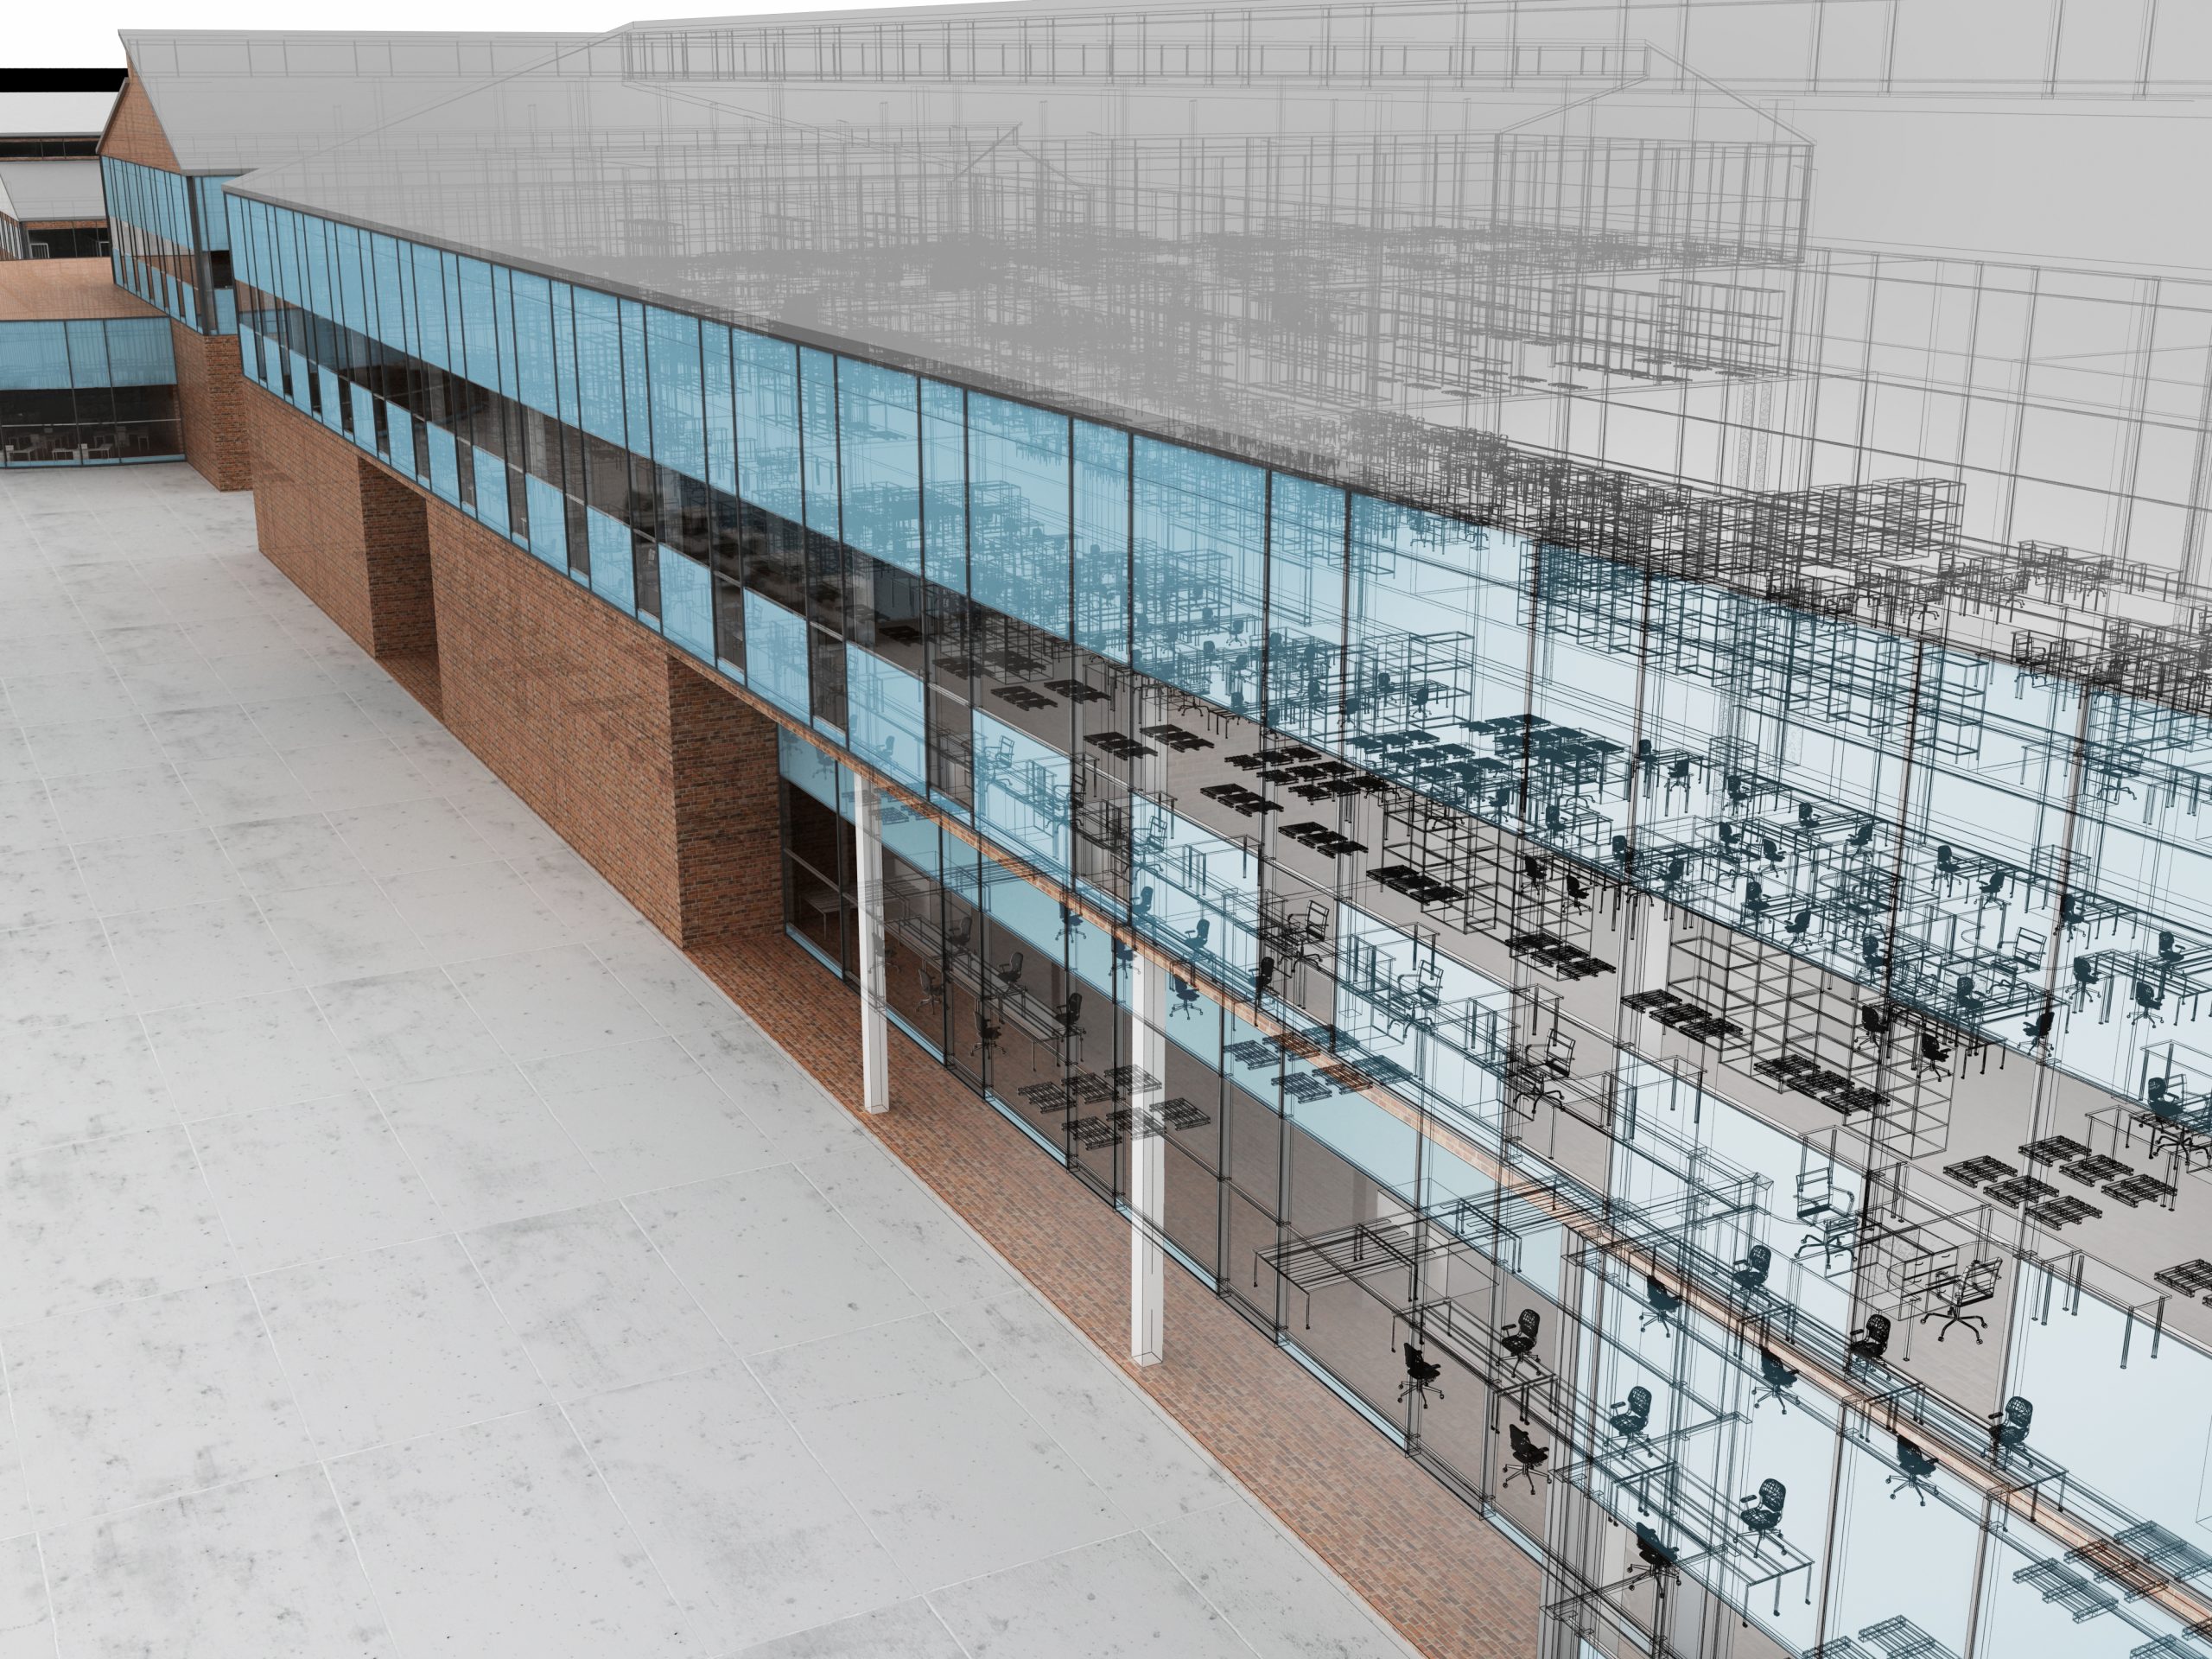
Zone mapping is the first step on every Denver building we add to our inspection program. Before the first inspection report, we produce a zone diagram keyed to the building's actual roof layout - physical dimensions, drain locations, mechanical equipment positions, parapet geometry, expansion joints, and access points. Zones are numbered sequentially and sized to meaningful physical boundaries: an expansion joint defines a zone boundary, a drain cluster defines a zone, a mechanical equipment island defines a zone.
The zone system then anchors every photo in every subsequent document. Every inspection photo is labeled with a zone number and defect descriptor. Every post-hail assessment photo is keyed to the same zone number. Every core pull from a moisture survey is plotted by zone number on the distribution map. When the fifth inspection references 'zone 7,' every member of the facilities team, the asset management group, and the capital committee knows exactly where zone 7 is, what it looked like across four prior inspections, and what the current report says about its condition.
We start with the building's roof plan where one exists - from the original permit set, the as-built drawings, or the building's facility team records. Many Denver buildings, particularly the 1970s-1980s office and industrial stock, do not have readily available roof plans, in which case we measure the roof geometry on-site. The diagram is drawn to scale with roof section areas labeled in square feet per zone, drain locations marked, rooftop equipment positions documented, and roof access points noted.
Zone numbering follows a consistent convention: zones run north-to-south and west-to-east, numbered sequentially from northwest to southeast so that zone 1 is always the northwest-most section. Sub-zones for specific details within a main zone use a letter suffix - zone 4A for the field membrane, 4B for the parapet return, 4C for the drain detail. For buildings with multiple roof levels, each level receives a separate zone diagram with a building-level prefix to prevent zone-number collisions across a complex footprint.
For Denver campus accounts - UCHealth facilities at the Anschutz Medical Campus, Denver Public Schools buildings across the district, Buckley Space Force Base facilities with multiple structures - the zone diagram system scales to the campus. Each building within the campus gets its own zone diagram, and the campus-level condition summary references building IDs consistently so the facilities management team can navigate the full campus record without a contractor present.
Post-Hail Assessment Documentation Using Zone Diagrams
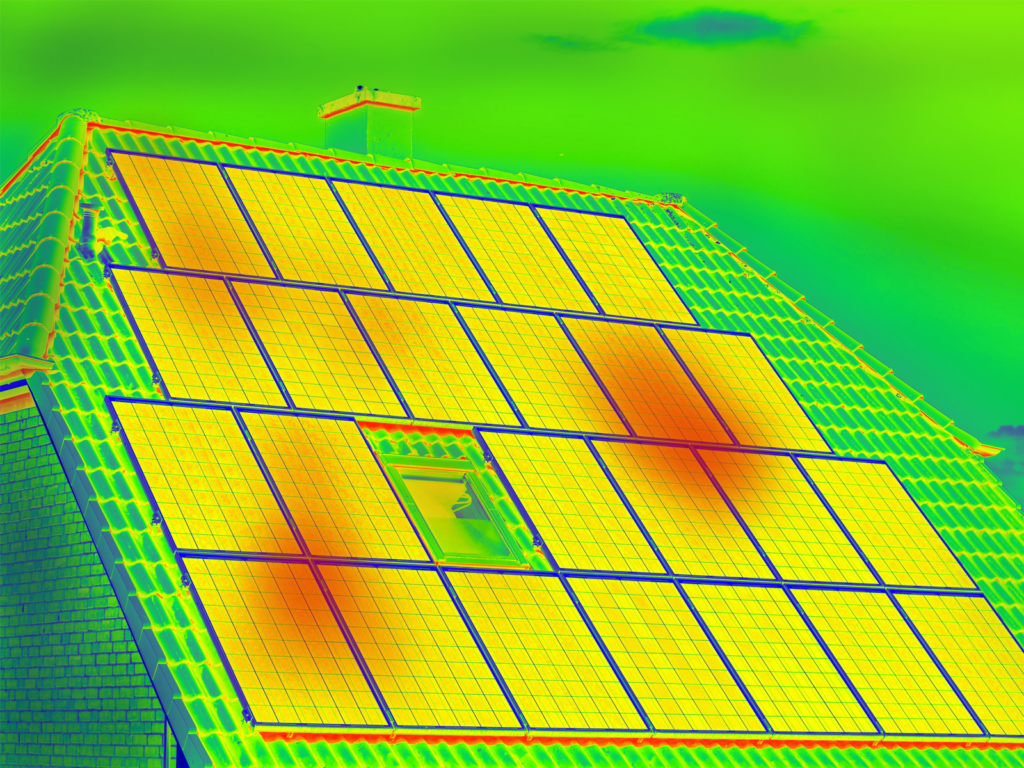
Denver's hail season makes the zone diagram especially valuable as a post-storm documentation tool. When a significant hail event crosses the metro, we run rapid assessments on maintained buildings and photograph every zone - documenting both damaged and undamaged zones. The undamaged zone documentation is as important as the damaged zone documentation: it demonstrates that the membrane condition in those areas cannot be attributed to the storm event, which supports the claim for the zones that were affected.
Insurance adjusters and manufacturer warranty field representatives respond differently to a post-storm assessment organized by zone diagram than to a collection of labeled photographs. A zone-keyed assessment allows the adjuster to navigate the building's roof systematically, match photos to locations, and separate storm-attributable conditions from pre-existing deterioration that the prior inspection record documents. That navigability reduces claim processing time and reduces the likelihood of dispute over the scope of the storm-related damage.
We maintain the zone diagram and the full inspection record for every building in our program regardless of ownership transition. When a building sells, we provide the full condition record to the new owner's facilities team or acquisition due-diligence team upon request. The zone diagram does not change with ownership - the same numbering system that the prior owner's facilities director used applies to the new owner's first inspection. That continuity is particularly relevant for buildings with manufacturer warranties that transfer with the deed, since the warranty transfer inspection requires a condition assessment documented against the prior maintenance record.
| Scope Format | Written roof plan and photo record |
|---|---|
| Primary Market | Denver commercial buildings |